Air Quality: How COVID has Changed the Way we Design Indoor Spaces
Posted on February 28, 2022
What the Science Tells Us
There are multiple ways in which respiratory particles are generated as follows:
- Saliva in the mouth is aerosolized during the interaction of tongue, teeth, palate and lips during speech articulation
- Fluid bathing in the larynx is aerosolized during voicing due to vocal fold vibrations
- Fluid blockages from inside the respiratory bronchioles during exhalation and then burst during subsequently inhalation producing particles which are then exhaled.
After particles form, they undergo a complex transformation as they pass through the respiratory tract before they are respired. The outcome can be a process of deposition i.e. change in initial size distribution. This is a very important fact that needs to be considered when looking at transmissibility as the size of the particles has a direct correlation to their ability to be airborne for long periods of time. Wells who is considered by many to be one of the fathers of research in the area of airborne transmission of infectious diseases had published a paper that suggested particles 1000µm, 100µm, 10µm and 1µm in size could be airborne for 0.3s, 3s, 300s and 30,000s respectively, with particles being less than 10µm being of key interest when considering the transmissibility of airborne pathogen since they represent the majority of all particles expelled by the mouth. Bourouiba, L., et al. (2014) explains the dynamics of respiratory particles during a cough or sneeze in Figure 1, where larger particles fall to the ground, whereas the column of smaller particles continue to expand as they float away from the jet source, which would then be subjected to eventual mixing with ambient air.
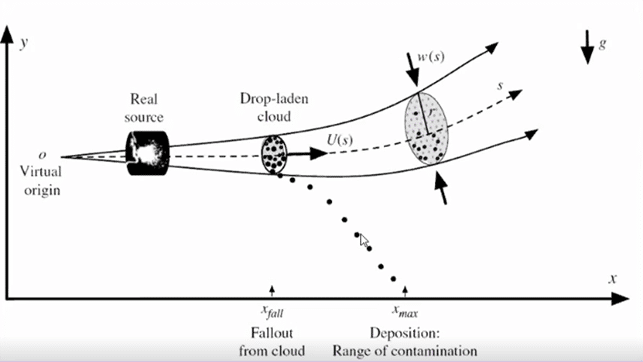
Figure 1. Bourouiba, L., et al. Violent expiratory event: on coughing and sneezing, Journal of Fluid Mechanics, 745:563, 2014
At the outset of the pandemic, various countries had put in place social distancing measures to limit the spread of SARS-CoV-2 particularly in relation to community interaction within indoor spaces. It was quite interesting to see the different levels of social distancing countries were adopting between 1m and 2m. This could inexplicably be tied to the type of respiratory activity considered as the worst case, whether a heavy activity (i.e. cough/sneeze), moderate activity (i.e. talking) or light activity (i.e. breathing). Prof. Yuguo Li during a recent presentation as part of the International Workshop on Infectious Disease and Airflows around Human Body presented a curve that showed a relationship between dilution factor of total exhaled content and distance from the mouth of a two-stage jet (i.e. when a jet transitions from a jet to a puff) for different activity types with Dilution Factor of 100 being seen as an acceptable level of dilution as shown in Figure 2. This figure highlights that the social distancing measures put in place in the various countries could be seen as correct depending on what type of activity they are trying to prevent exposure to.
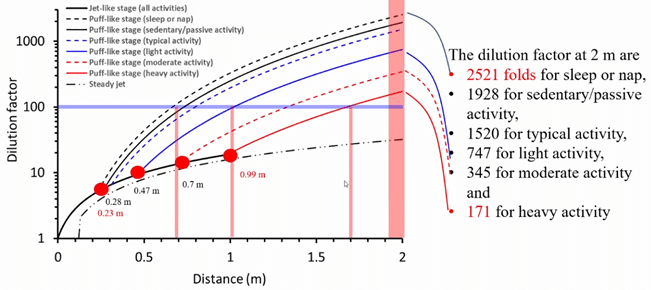
Figure 2. Dilution factors calculated based on the steady jet and the two-stage jet when the discharge orifice is 0.02m
While there is a decent level of understanding relating to the physics of human expiratory activities in the area of droplet size and droplet concentration, there is much less knowledge about the relationship between droplet virus concentration as a function of droplet size from real infecting agents expelled by infected individuals, as well as the probability of infection. These metrics are of key importance in understanding the actual spread of viral infections and in the development of appropriate infection risk criteria that could be used for indoor ventilation or air filtration modelling. Figure 3 shows an example of criteria for SARS-CoV-2 that could be used to drive proper modeling of indoor spaces from a ventilation/air filtration perspective, with more research being done as new variants materialise with different infection risk profiles. Furthermore, it should be noted that research needs to extend to the study of interpersonal variability as this knowledge could be critical in explaining the ‘super spreading’ capabilities of some individuals, hence the reason why criteria have been developed for the typical case for a given pathogen. This generally requires obtaining key parameters from real-life outbreaks, and there are many examples of such models being put together by researchers around the world before the pandemic, and even more so since the onset of the pandemic i.e. Stable, L., Buonanno, G. and Morawska, L. (2020), Miller et al. (2021), Azimi et al. (2021) and Kriegel et al. (2020).
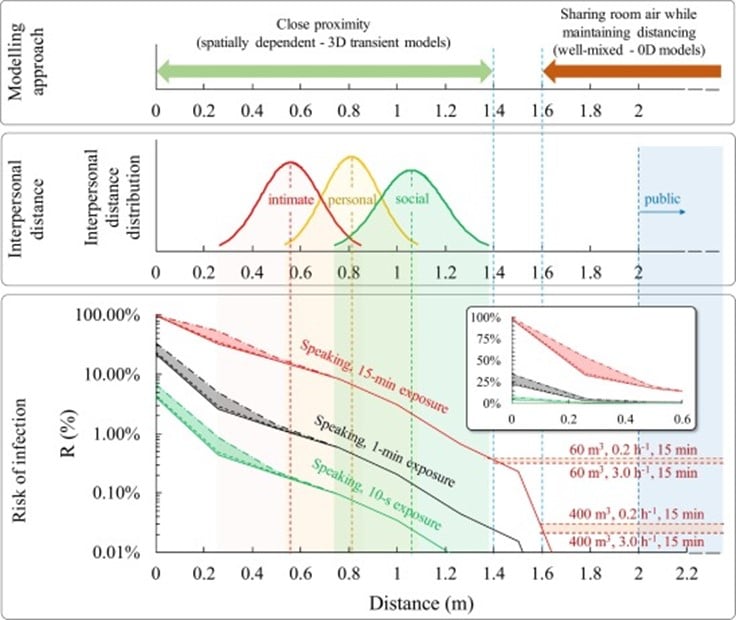
Figure 3. Cortellessa, L., et al. 2021. Close proximity risk assessment for SARS-CoV-2 infection. Science of total Environment, 794: 148749
Modeling and Mitigation
Some would suggest that a quick fix is to open the window. In December 2021, the World Health Organisation (WHO) published a poster focusing on ventilation and its main narrative was that people should always have windows open to ensure adequate ventilation to reduce exposure risk. This concept is not considered a novel one, in fact, Florence Nightingale an English social reformer, statistician, and founder of modern nursing back in 1859 discussed the role of opening the window. She went on to say, “Always air from the air without, and that, too, through those windows, through which the air comes freshest”. The issue with natural ventilation is that it is only effective when the conditions are right i.e. not too hot, not too cold, not too noisy. In reality, most climates do not allow for these conditions to be right most of the time, hence the window remains closed and there is no ventilation, or minimal ventilation if you take into consideration that most buildings are not airtight or have been somewhat designed to ensure that a certain % of dwellings achieve effective natural ventilation through various means.
So then how can we improve indoor air quality without ventilation? There have been a number of studies in this area that focus on the issues associated with the mechanisms behind infection transmission, and there has been evidence in research that filter-based air cleaners do work if used properly. An example of a research paper in this area is one presented by Zhao, B, Liu, Y. and Chen, C. (2020). It should however be noted that air purifiers cannot eliminate the accumulation of CO2, VOCs, and other gaseous indoor-generated pollutants if there is no ventilation, and this can have negative impacts on human health and function within a space. Hence air purifiers are not an effective solution in isolation. Morawska, et al. (2020) provided some guidance as to what measures could be used to minimize the transmission of SARS-CoV-2 using a mixture of measures as presented in Figure 4, and this included sufficient and effective ventilation, avoiding air recirculation, particle filtration and air disinfection, and avoiding overcrowding.
Figure 4. Morawska, et al. How can airborne transmission of COVID-19 indoors be minimised?, Environment International, 142: 105832, 2020
Sufficient ventilation entails that there is enough ventilation, it is available everywhere and there is no air flow from person to person. There are few well known sources that talk about what is considered sufficient as follows:
- WHO – non-residential settings: 10 L/s/person (EN 16798-1)
- ASHRAE – e.g. 9.5 L/s/person and 4 L/s/person, for an art class and lecture hall wind fixed seats
- REHVA – 10 L/s/person in typical spaces (EN 16798-1; ISO177722-1:2017)
- Standards Australia – 10 L/s/person (for most cases) AS 1668.2: 2012
However, most of the above standards do not take into consideration the number of people that will be present in a space, what activities they are conducting, and the risk of infection which varies for each pathogen and its variants. The only effective method to assess whether an indoor space is sufficiently ventilated is to use risk assessment models and tools. With this approach, it is possible to build a risk model, calculated the required ventilation, set up ventilation, and verify the outcomes. This can be done on a venue-to-venue basis since the conditions and risk models for each venue differ from one another. There are however limits observed when the individual risk of infection percentage is high such that in some cases required ventilation is higher than what mechanical systems can provide. An example of this is presented in Mikszewski et al. (2021), where the study indicates that with highly infectious viruses such as Adenovirus, TB, SARS-CoV-2, and Measles not even a high ventilation rate of 14 L/s/person was sufficient to maintain event reproduction below acceptable levels.
Therefore, disinfection can be added to the basket of mitigative measures, for example, Germicidal Ultraviolet (GUV) air disinfection, which is low energy, does not generate new pollutants, and is robust from a maintenance and cost point of view.
With the above risk model, the nature and extent of the above-mentioned mitigative measures tuned through detailed numerical analysis of airflow distribution and direction using advanced Computational Fluid Dynamics (CFD) analysis of a single room/dwelling, or an entire floor plate or building with multiple floor plates. Such numerical modeling can take a long time to solve, however with access to powerful computer clusters like the ones used at Windtech with over 10,000 CPU cores, these computationally intensive simulations can be done in a fraction of the time.
With all this in mind, it is possible to shift toward a performance-based design approach (i.e. away from a code-based design approach) by adopting advanced modeling techniques that consider key parameters that influence the design of indoor spaces from an air quality point of view.
If you have any questions relating to the content of this article or wish to speak to one of our experts in the area of air quality for both indoor or outdoor spaces, please reach out to our regional office via our Contact Us page.
To get regular updates on news and events, please follow us on our LinkedIn page.
References:
- Bourouiba, L., et al. Violent expiratory event: on coughing and sneezing, Journal of Fluid Mechanics, 745:563, 2014
- Li. Y, Dilution factors calculated based on the steady jet and the two-stage jet when the discharge orifice is 0.02m, International Workshop on Infectious Disease and Airflows around Human Body, 2022.
- Cortellessa, L., et al. Close proximity risk assessment for SARS-CoV-2 infection. Science of Total Environment, 794: 148749, 2021
- Stable, L., Buonanno, G. and Morawska, L. Quantitative assessment of the risk of airborne transmission of SARS-CoV-2 Infection: prospective and retrospective applications. Environment International, 145:106122, 2020.
- Miller et al. Transmission of SARS-CoV-2 by inhalation of respiratory aerosol in the Skagit Valley Charale super spreading event. Indoor Air, 31(2):314-23, 2021.
- Azimi et al. Mechanistic transmission modeling of COVID-19 on the Diamond Princess Cruise ship demonstrates the importance of aerosol transmission. PNAS, 118(8): e20154821188, 2021.
- Kriegel et al. Predicted Infection Risk for Aerosol Transmission of SARS-CoV-2. medRxiv, 2020. doi: https://doi.org/10.1101/2020.10.08.20209106
- Nightingale, F, Notes on Nursing, What it is, and what it is not, 1959
- Zhao, B, Liu, Y. and Chen, C. Air purifiers: A supplementary measure to remove airborne SARS-CoV-2. Buildings and Environment, 177, p.106918
- Morawska, et al. How can airborne transmission of COVID-19 indoors be minimised?, Environment International, 142: 105832, 2020
- EN 16798-1:2019, Energy performance of buildings – Ventilation for buildings – Part 1: Indoor environmental input parameters for design and assessment of energy performance of buildings addressing indoor air quality, thermal environment, lighting, and acoustics – Module M1-6, European Standards, 2019
- ANSI/ASHRAE Standard 62.1-2016, Ventilation for Acceptable Indoor Air Quality, The American Society of Heating, Refrigerating and Air-Conditioning Engineers is an American, 2016
- BS ISO 17772-1:2017, Energy performance of buildings. Indoor environmental quality Indoor environmental input parameters for the design and assessment of energy performance of buildings, International Organization for Standardization, 2017
- AS 1668.2: 2012, The use of ventilation and airconditioning in buildings Mechanical ventilation in buildings, Standards Australia, 2012
- Mikszewski et al. The Airborne Contagiousness of Respiratory Viruses: A comparative Analysis and Implications for Mitigation. Journal of Infectious Diseases, Accepted 8th August 2021, In Press. Published Online:101285. 2021