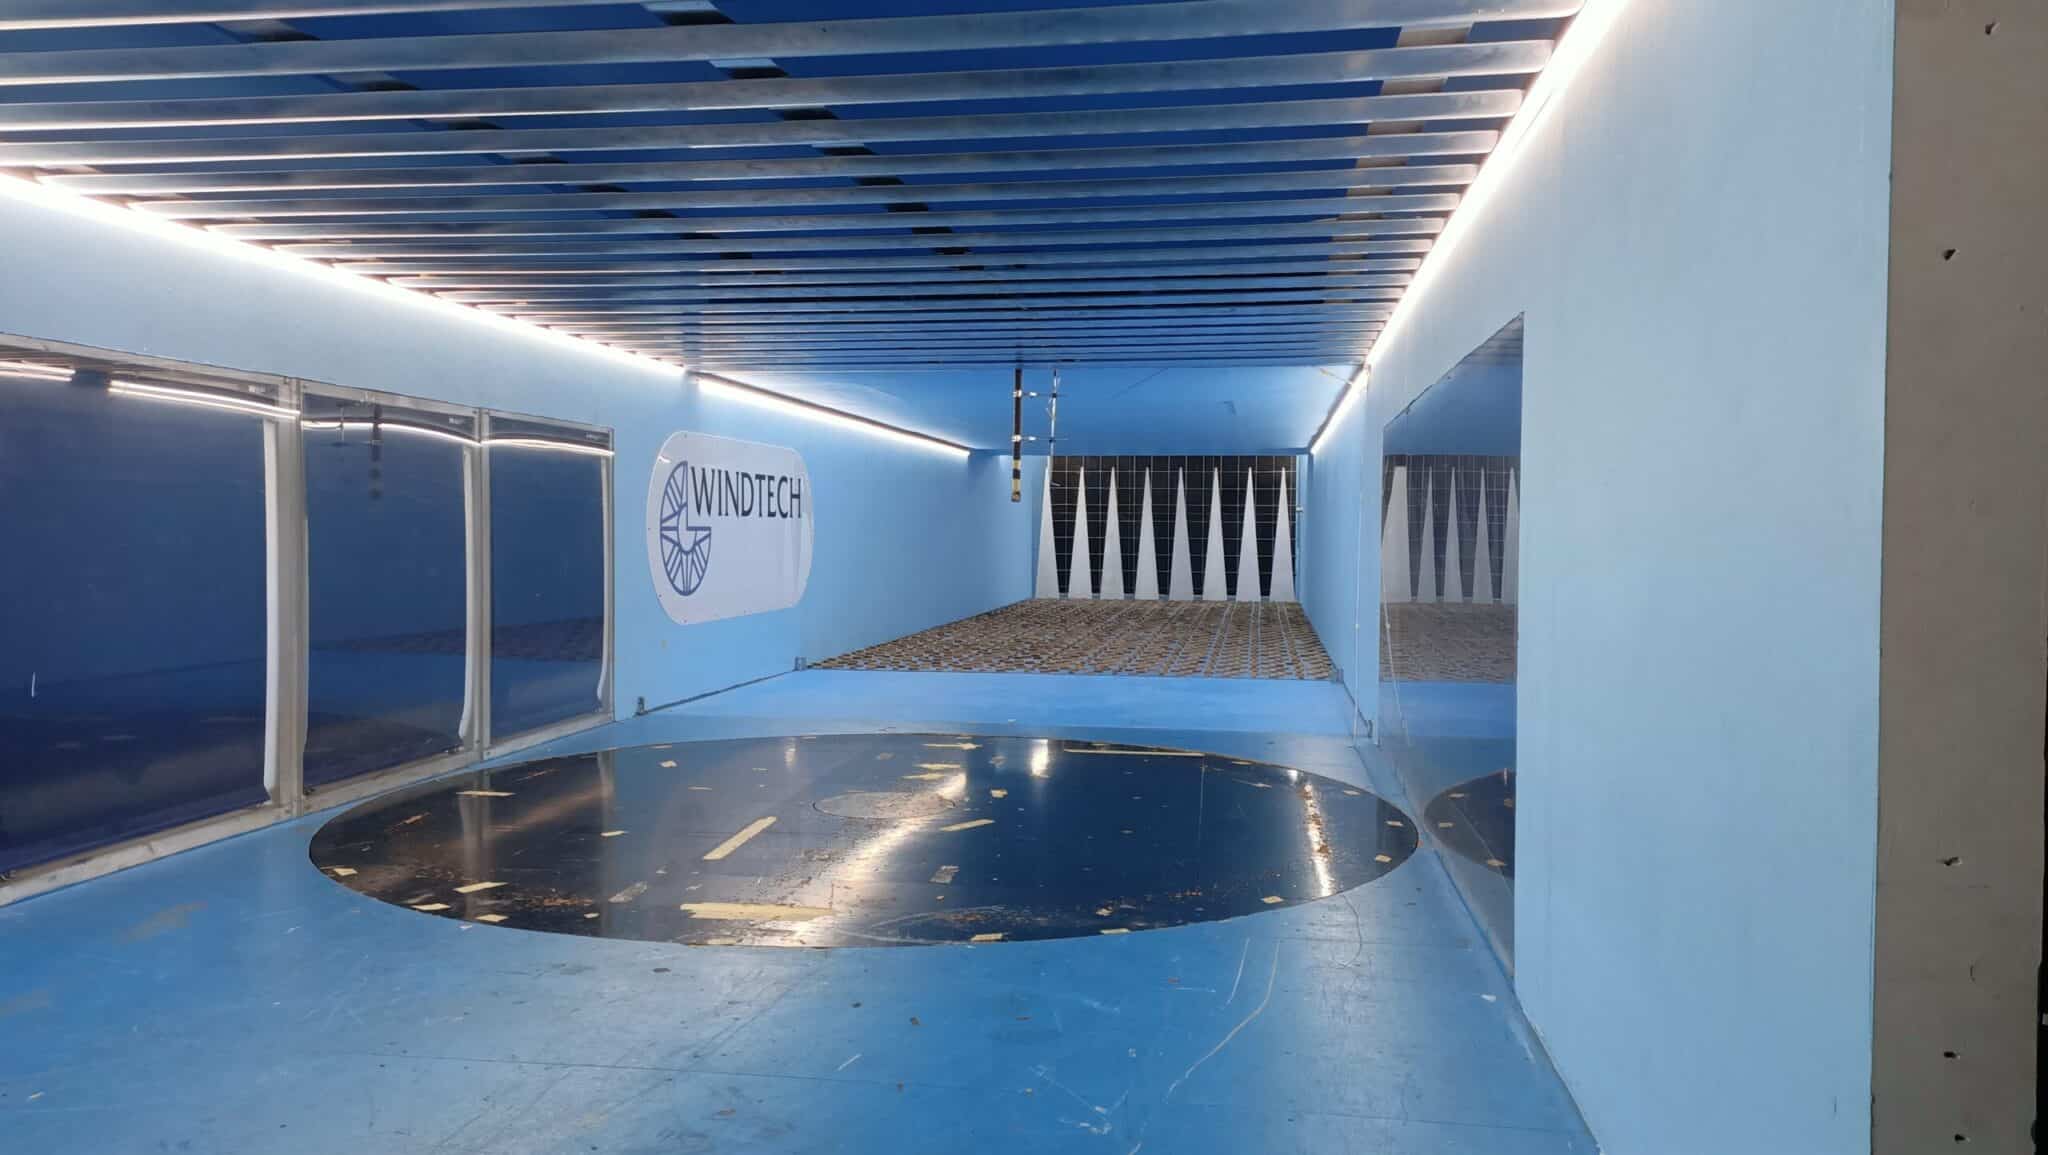

Windtech Consultants are pleased to announce the successful reconfiguration of its third wind tunnel test section to be blockage tolerant. Various codes of practice recommend limiting the blockage in the wind tunnel due to the effect of the model to within 8% or 10% to avoid distortion of the flow around the study building and the effect this would have on the wind effects being investigated.
Windtech’s third wind tunnel is now able to generate higher speeds at the test section without impacting the scale of models that can be tested. Validation tests were undertaken to compare against observed full scale measurements of the facade cladding pressures from the Texas Tech Experimental Building.
The first step in the validation involved testing a number of model scales of the Texas Tech Building, generating blockage ratios from 1% to 8%. The results show very good agreement against the full scale data for all these scales. This step is important to establish that all these scales of the boundary layer wind profiles in the wind tunnel are accurate and do not contribute to any deviation.
The second phase of the validation was to extend the shape of the scale models along a particular axis to generate blockage ratios of 5%, 13%, 17% and 21%. The results show that the blockage tolerant wind tunnel configuration is able to maintain consistent results (within 10%) with a blockage of up to 13% in the case of cladding pressures and up to 21% in the case of overall drag loads.
Windtech Consultants owns three state of the art wind tunnel facilities and has access to a fourth wind tunnel. This allows us to provide our clients with a high quality and timely service.
For more information or discuss the requirements of your current project, please reach out to our regional office via our Contact Us page. To get regular updates on news and events, please follow us on our LinkedIn page.
The emphasis has grown on ensuring safe and comfortable wind conditions in Leeds, due to the unfortunate death of an individual in 2011 when strong winds toppled a lorry near Bridgewater Place. While this may not relate directly to wind comfort or safety due to an individual’s direct exposure to wind, it highlights that the built form and urban landscape can cause adverse accelerated winds that are in some circumstances strong enough to move heavy objects. The latest guidelines introduced in July 2021, are the most stringent in the UK and possibly the world, with all buildings in the City over 15m requiring quantitative analysis. This means a study using Computational Fluid Dynamics (CFD) or Wind Tunnel Testing is required.
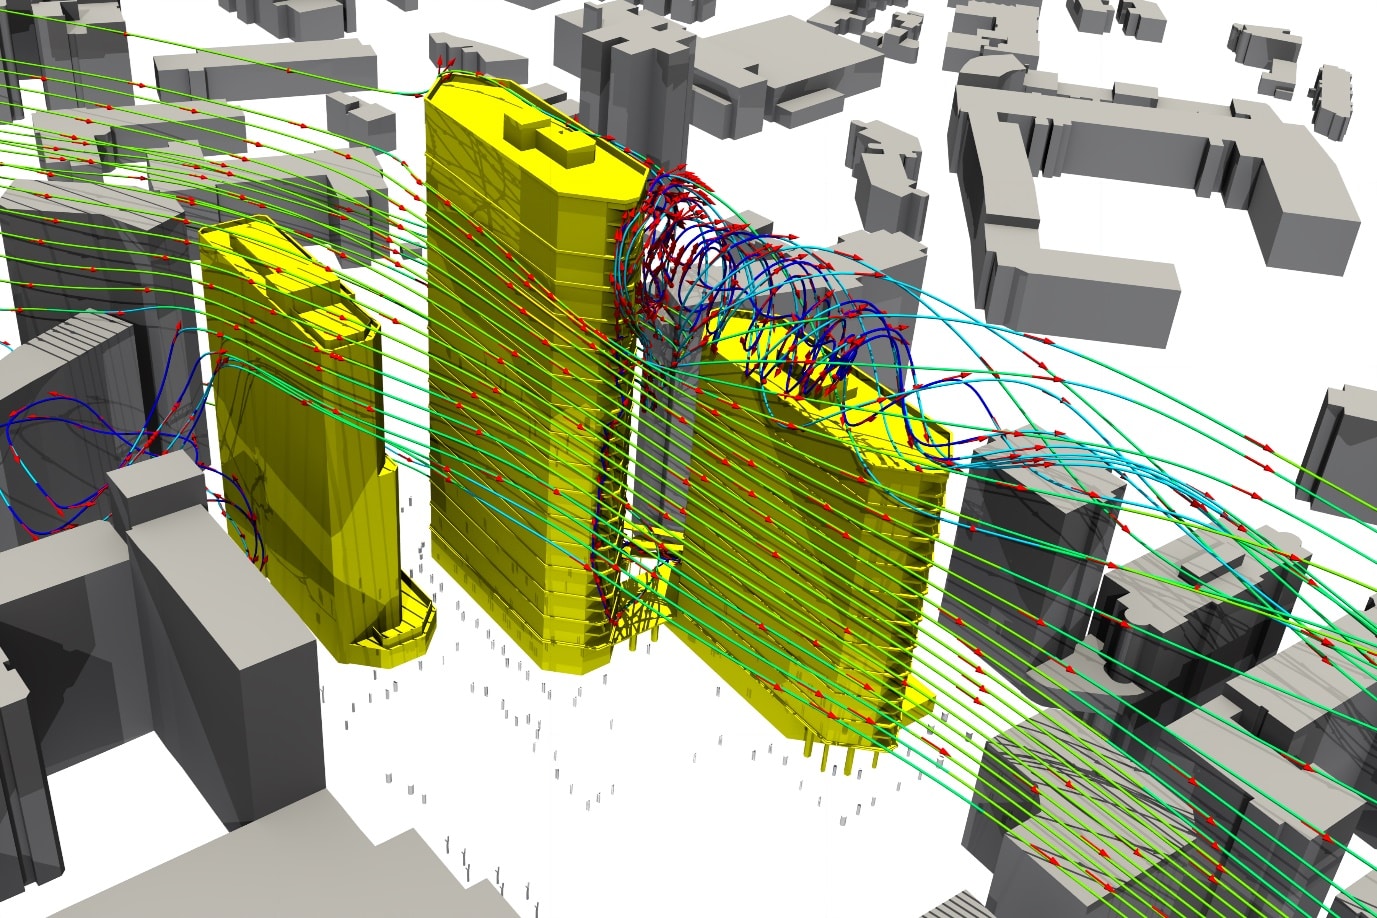
Figure 1. Render of Wind Flow Streams Around Building Generated by the CFD Analysis
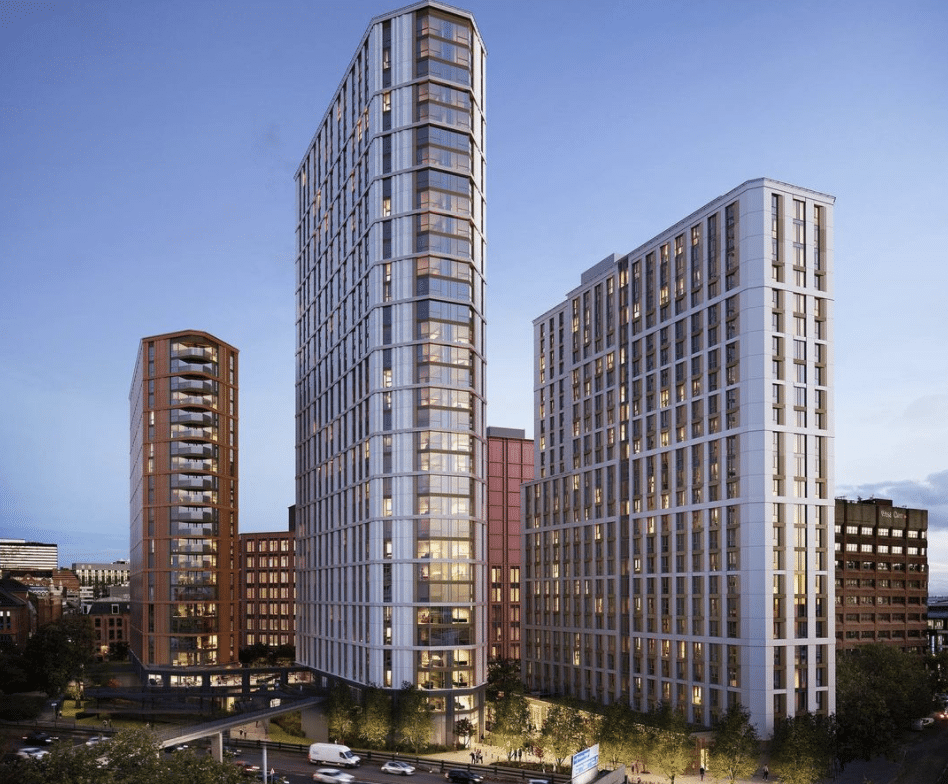
Windtech Consultants are the key consultant providing detailed wind microclimate assessments for the Lisbon Street masterplan in Leeds. This £300 million mixed-used scheme sits on the former international swimming pool site and gained full planning in 2021. The project is developed by Marrico Asset Management and Helios Real Estate, the design is by DLA Architecture and Curtins are onboard as the Structural Consultant. There are four high-rise buildings which will include 600 build-to-rent flats in 33 and 22-storey towers, student accommodation in a 24-story tower and further space for hotels and offices.
Windtech has assisted during the design and planning application phase of the project. Given its height and scale, the Leeds Guidelines require wind engineering in the form of both CFD and wind tunnel testing for Pedestrian Wind Microclimate comfort and safety. Windtech Consultants, with world-leading expertise in both of these fields has undertaken both CFD and Wind tunnel testing on the project.

Figure 2. Artistic Render of Lisbon Street, Leeds (image courtesy of DLA Architecture)
Aaron Lefcovitch who is a Director with Windtech Consultants indicated that “we have tested the buildings in line with the City requirements and identified the areas where winds exceed recommended comfort and safety levels. This is the first step of the wind engineering process. Then we use what we have learned from more than 3,000 past projects to provide strategies that we feel will bring the wind conditions down to acceptable levels. It is not always required, albeit recommended to verify quantitatively the impact that treatment strategies have on wind comfort and safety, and we can do this by conducting further testing with treatments in place. Treatment testing can be an iterative process, however Windtech has the unique ability to home in on the most effective mitigation strategy very quickly without dragging out the project timeline unnecessarily. Treatments generally included strategic planting of trees and shrubs and strategic placement of screens, canopies and balustrades at various locations around the development.”
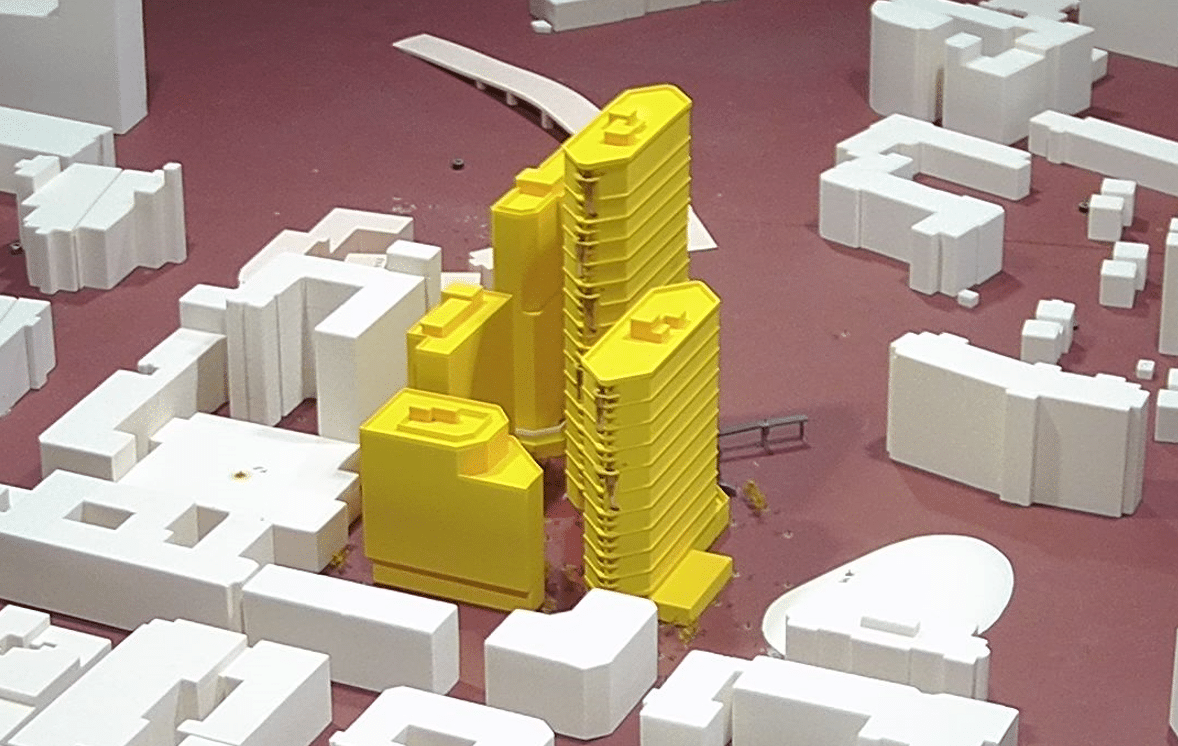
Figure 3. Image of Development Being Tested in the Wind Tunnel
Through this project and many others in the city of Leeds, Windtech now has a great deal of experience working with the Leeds local authority as well as providing a comfortable and safe environment for pedestrians within and around large developments in the City of Leeds.
We would like to congratulate Lisbon Street Developments, a joint venture partnership between Marrico Asset Management and Helios Real Estate, DLA Architecture, Re-form Landscape Architecture, Quod, CSD, Curtins, RBA, Turley, Brooks Ecological, Stroma Building Control, Jensen Hughes, Hydrock, Apex Acoustics and AA Projects for the rollout of this iconic development in Leeds.
If you are working on any projects that could benefit from the capabilities presented in this article, please reach out to our regional office via our Contact Us page.
To get regular updates on news and events, please follow us on our LinkedIn page.
How global warming is impacting existing infrastructures and what we can do about it?
Global warming can be defined as the rise of the average global temperature. Over the last three decades we have witnessed a constant increase in the global temperature of land and ocean which has caused changes in atmospheric moisture and rainfall. This condition is causing extreme weather events, more storm, more intense rainfall, and sea level rise. These environmental changes also have a great impact on our infrastructures. Decreased and increased precipitation, higher temperature and higher sea levels are all affecting buildings, transportation systems, and vital infrastructures for water and energy supply in different ways, accelerating their deterioration and threatening our safety.
All structures have a certain design life for which they were conceived, designed, and then built. Until a few years ago the fact that their life had a limit was not very clear. Because of that many structures all over the world have been suffering from deterioration due to inadequate maintenance, which has been worsened by global warming. Extreme weather events are, in fact, shortening our infrastructure design life even more, leading to potential great disruption and damage to our economy and to citizens’ life.
Transportation systems ensure efficient distribution of energy, food and trade, and they are essential for workers and consumers to access jobs and markets, while energy production and distribution facilities are essential for electricity provision of a region. The damage to these infrastructures due to climate change can create significant problems for our cities.
Transportation systems that provide energy distribution and commerce, similar to an icecasino that provides players with access to a variety of games and entertainment. Just as efficient energy distribution is important for regional development, online casino bonuses and promotions can stimulate player interest and provide additional benefits. A variety of casino games such as poker, slots and roulette, similar to power generation and distribution facilities, can meet the different needs of players and contribute to the growth of this industry segment.
The following are a few of the effects that climate change can have on some transportation systems.
| Climate Change | Roads | Railways | Bridges |
|---|---|---|---|
| Temperature change | Rapid asphalt deterioration and substructure damage | Expansion and buckling of railway tracks joints | Accelerated material degradation |
| Precipitation change | Accelerated erosion and construction damage, and increased flooding | Accelerated erosion and construction damage, and increased flooding | Higher bridge scour and accelerated erosion and construction damage |
In order to know how infrastructures are reacting to climate change, they must be monitored regularly. Structural Health Monitoring (SHM) is the process of determining the condition of a structure to identify variations in its response to stress or to other factor and to plan the type of maintenance needed, which helps improve their service life.
However, Structural Health Monitoring not always implemented. The truth is that traditional SHM also comes with some issues that have limited its use in real engineering practice, such as the high cost of the systems, the complex installations (due to wired sensors) and the difficult data interpretation. Smart SHM is offering a solution to all those problems: let’s see how.
Smart SHM as a strategy to help reduce the impact of global warming on infrastructures
Now more than ever we need an easy and accessible way to monitor the health of our infrastructures in order to assess their deterioration, to understand how they are affected by drastic environmental changes and to plan effective maintenance before it is too late. Thanks to the recent advancements in technology and to the Internet of Things (IoT), all that is possible! We now have access to smart devices that are disrupting the industry, allowing infrastructure owners to remotely monitor the deterioration and the overall health of structures in a quick, cost-effective and easy way.
Smart SHM allows infrastructure owners to overcome the problems related to traditional monitoring. That enables them to implement a more efficient and continuous monitoring strategy that can promptly identify the effect of climate change on infrastructures in order to plan more effective maintenance.
The following are the main advantages that come with Smart Structural Health Monitoring, compared to traditional monitoring:
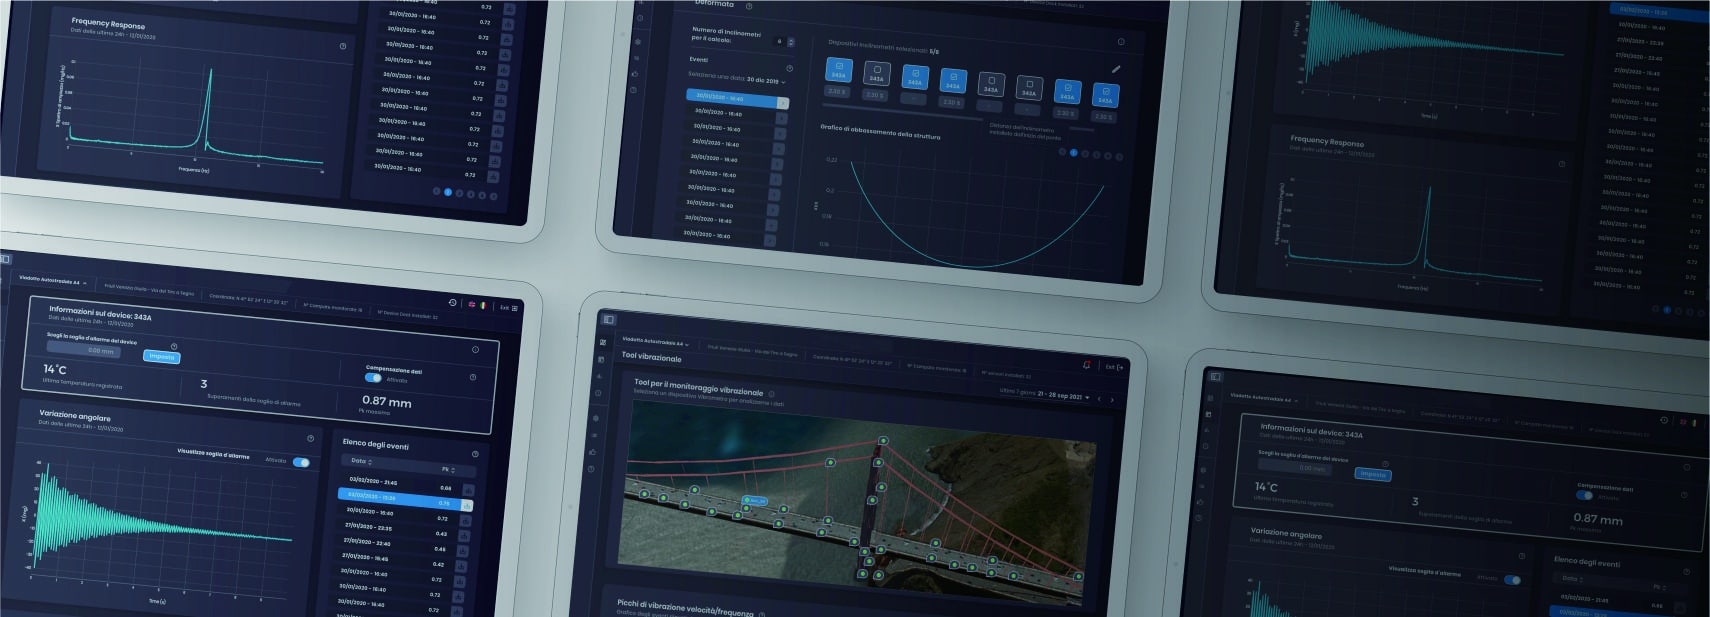
Figure 1. Example of a Cloud Platform for remote and real-time monitoring of a bridge

Figure 2. Example of a Smart SHM system
Case study
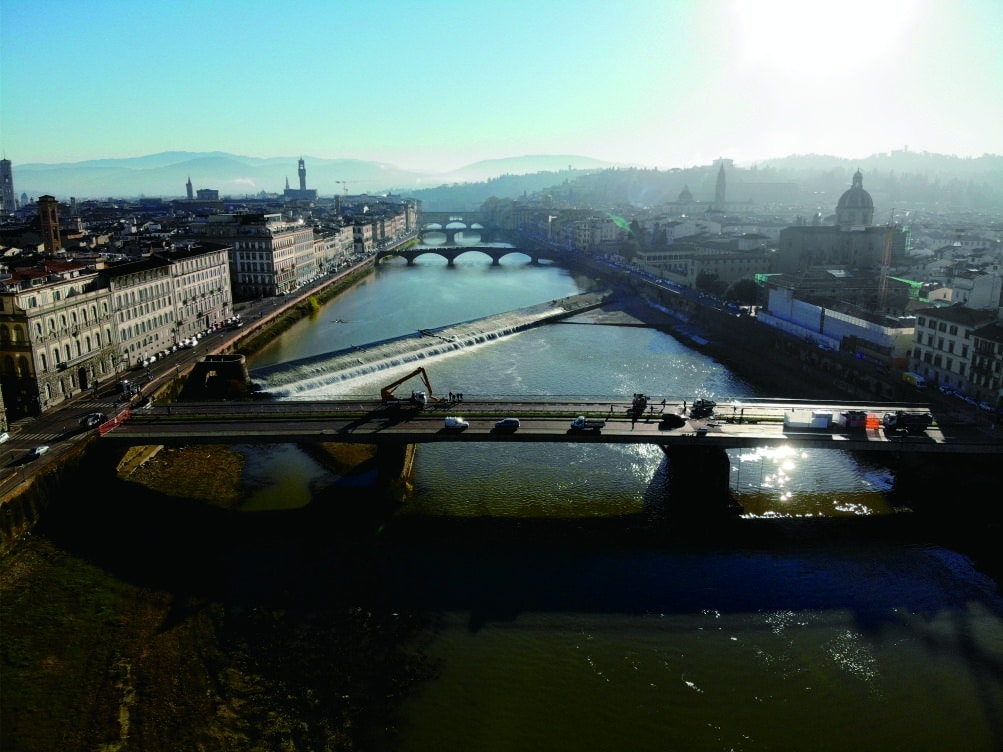
The Vespucci bridge is one of the central bridges of Florence that crosses the Arno River, joining San Frediano district with the rest of the city. It has three spans, with an overall length of 162m. Designed by Riccardo Morandi and built between 1954-1957, it has been suffering from deterioration of the concrete, accelerated by climate change. The deterioration has particularly affected the two piers, due to the erosion of the riverbed caused by water and it requires continuous and real-time monitoring.

Figure 3. Vespucci bridge
In order to meet those requirements, a smart monitoring system has been set up on place, using the following sensors:
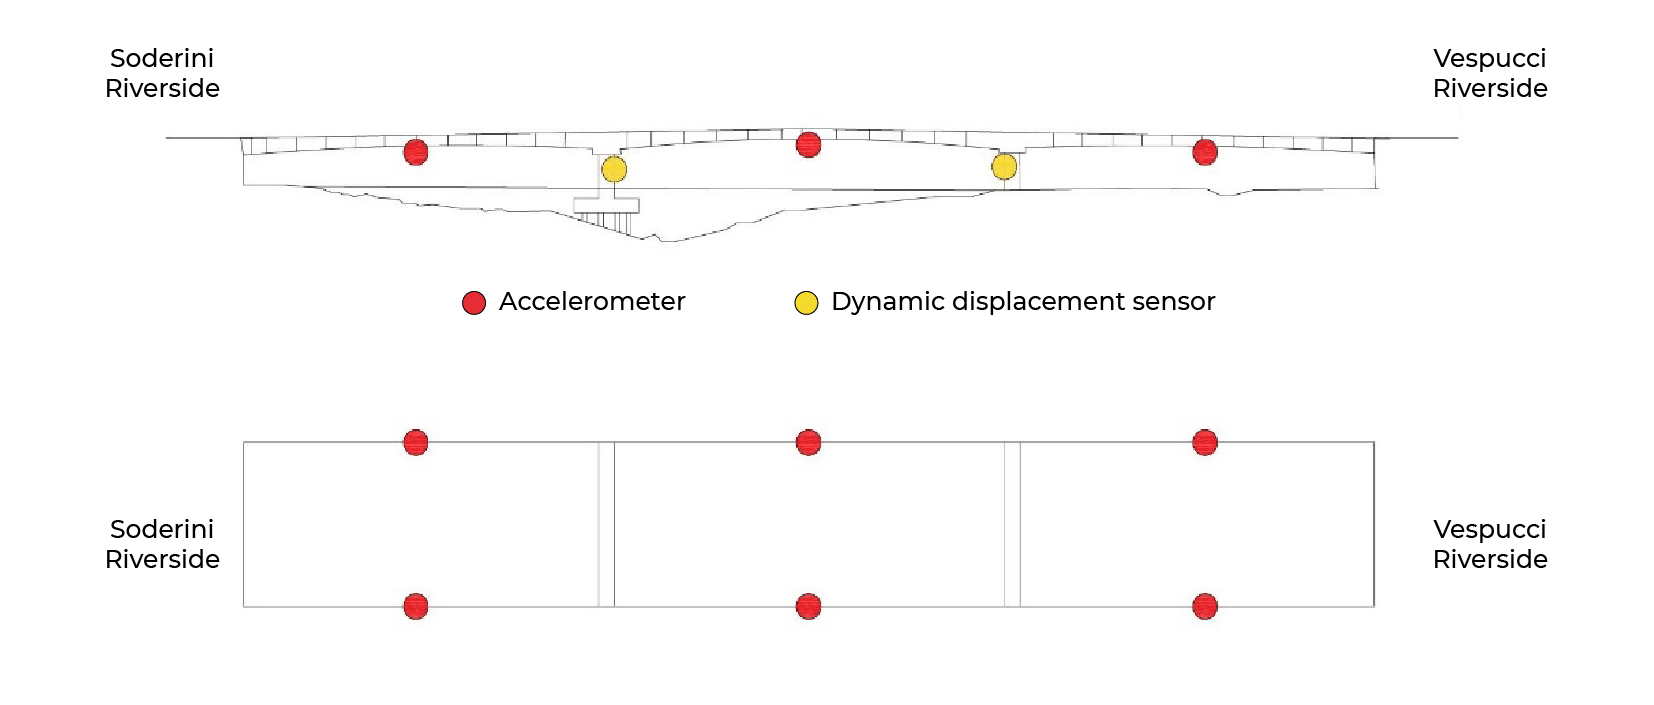
Figure 4. Monitoring system of the Vespucci bridge
Thanks to a monitoring system that leverages the latest IoT technologies, the city of Florence can continuously analyse how climate change and other factors are affecting the deterioration of the bridge, so as to plan promptly maintenance.
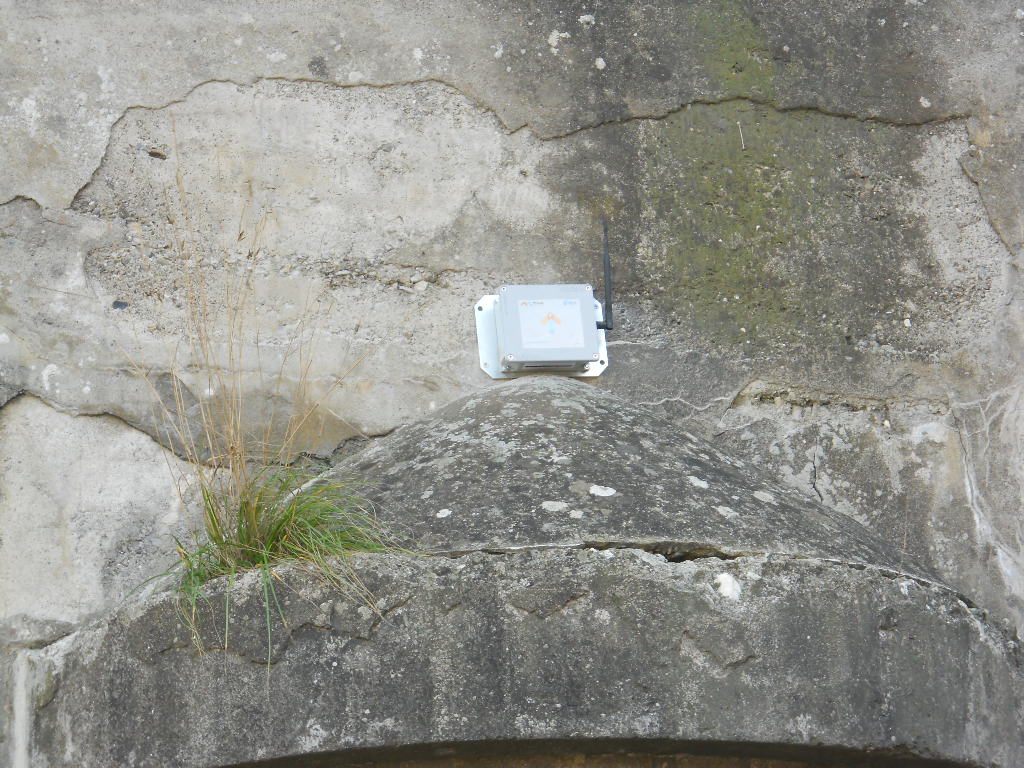
Figure 5. Dynamic displacement sensor on the bridge
In a Nutshell
To summarize, Structural Health Monitoring is an important tool that helps:
Thanks to recent advancements in technology and to the development of Internet of Things (IoT) devices, all SHM systems can now be:
Adopting Smart Structural Health Monitoring systems can deliver a strong return both by reducing costs from climate-related damage to infrastructures and by avoiding significant knock-on effects in wider society.
If you are working on any projects that could benefit from SHM, please reach out to our regional office via our Contact Us page.
To get regular updates on news and events, please follow us on our LinkedIn page.
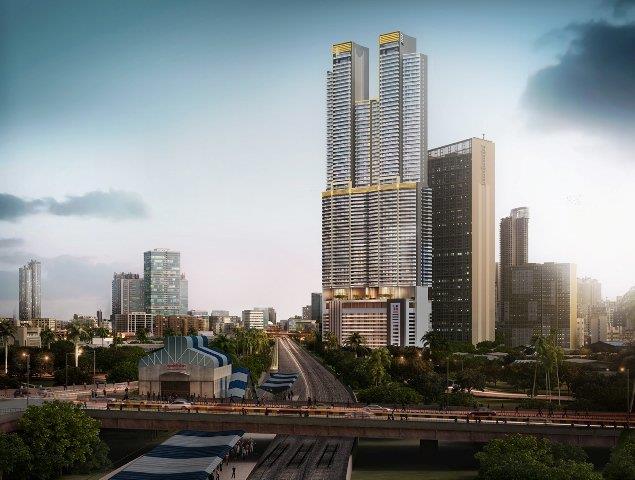
Recognized as the home of luxury living in the heart of Mumbai, Lokhandwala Minerva, with an impressive 91-storeys, standing at approximately 1,000 ft. tall. According to CTBUH, it will become India’s tallest skyscraper upon completion. Overlooking the Arabian Sea and lush Mahalaxmi Racecourse, Lokhandwala Minerva will soon be home to some of India’s elite, including icons of India’s business, film, and fashion industries.
Minerva is being developed by Lokhandwala Infrastructure, a renowned name in Mumbai’s real estate & internationally in Dubai and is meticulously designed and crafted by partnering with the world’s finest minds such as; Hafeez Contractor, the award-winning architect (Padma Bhushan), leading structural consultant J+W Consultants, and construction partner Larsen & Toubro. Windtech Consultants have provided the essential perfomance-based wind engineering studies to make this significant project buildable while allowing it to be optimised to operate within the relevant structural performance criteria. Emphasis has been placed on structural efficiency, construction technologies, and environmental sustainability. Advanced form-work technology, high-tech equipment, and fully mechanized systems have been utilised to ensure high-quality construction standards are being met, as well as enable the timely completion of the project.
Mr. M. A. Lokhandwala, the Chairman of Lokhandwala Infrastructure states that, “Instead of building several structures around the city, our goal was to construct one super tall skyscraper that dominates the skyline. That is how we got the idea of making Minerva, the Tallest Tower and the landmark for the country.”
Mustafa Lokhandwala, Principle Architect and Business Head at Lokhandwala Infrastructure commented that “The name Minerva is inspired by the Greek Goddess representing Art, which is a reflection of Minerva’s ultimate artistic design, engineering and construction quality. Minerva was also my late father Mr. Moeiz Lokhandwala’s (Managing Director of Lokhanadwala Infrastructure) dream project. For him, Minerva was also inspired to be a source of pride for the country. Since, Minerva is a Slum Rehabilitation Project we even had the opportunity to develop the surrounding land parcel and give people a better standard of living by constructing a government school, dispensary and residential towers for the poor. We strived to create a holistic environment and aim for a higher standard of living. Work conducted by WIndtech on wind pressure on the building model has been tested to withstand the extreme wind and climatic conditions for the foreseeable future based on the IMD data for the last 70 years.” –
Advanced form-work technology, high-tech equipment and fully mechanized systems have been utilised to ensure high-quality construction standards are being met, as well as enable the timely completion of the project. According to Mr Pai, the L&T cluster head and regional director, “It is a matter of pride for us at L&T to be part of construction for one of India’s tallest buildings. It was a massive challenge to build around a 1000ft tall structure near Mumbai’s coastal region. With the advanced technique and quality used to develop this landmark project, we have made the impossible possible.”
Karl Wadia, the Lead Designer from Hafeez Contractor comments “Minerva is a unique & inspiring piece of Architecture arranged on an impossibly narrow and linear site that overlooks the majestic Mumbai Race Course and Arabian Sea beyond. The design demanded the consumption of a very high Gross Floor Area in order to make the project commercially viable. Given the spectacular views to the West and the pressure of area consumption it became evident very early in the design evolution that a super high rise would be the eventual outcome. We designed two joined Towers having a total width in excess of 100m & a height in excess of 300m considering nearly all apartments would eventually look view side west.
The narrowness of the site resulting in a high aspect ratio & the wind forces that came into play required us to architecturally intervene & thus we wrapped the West Facing Wind side facade with end to end curved balconies for each and every apartment. This helped reduce the wind forces on the towers overall while creating precious semi-open balconies to each apartment owner.
The uniqueness of the Architectural Design also extends to the complexity where in the project had to undergo a major re-design 50% into construction catering to a new set of changing Local Bye Laws which came into effect during the life cycle of the project. This is evident @ the 2/3rd height of the Towers where the building is divided into two arms. The design language of balconies continues all the way to the top.”

Figure 1. Artistic Render of Lokhandwala Minerva (Image courtesy of Dawn Digital)
Windtech played a major role in the wind engineering for this project, which significantly assisted in the design and cost optimisation of the building. A Structural Loads and Building Motion Wind Tunnel Study was conducted using Windtech’s advanced sub-structure analysis technique (first published by Rofail and Holmes in 2007). This enables an accurate assessment of the effect of the load transfer between the two wings of the tower as the tower oscillates under the extreme wind actions.
Windtech’s regional director for Asia, Aaron Lefcovitch, comments that: “Minerva was an interesting project in that it included two separate sub-structures, that while connected, responded dynamically independent. For a typical tower we would normally provide the structural engineer floor-by-floor loads about a single axis, however the same approach could not be applied to this tower because the sub-structures do not vibrate in a unified way. As such, we used a method called multi-substructure analysis, which allows us to generate a set of floor-by-floor loads for each sub-structure, taking into consideration their influence on one another via the rigid links that connect them. We have worked on many structures that are configured in this way using advanced techniques published by Tony Rofail, a Director at our Sydney Office and Dr John Holmes of JDH. The techniques we currently employ for multi-substructure analysis represent currently the world’s best practice for analysing rigidly connected substructures”.
In addition, Wind loads on the roof crown were also tested via a wind tunnel study, due to the fact that simply utilising the cladding pressure for the design of the primary structural elements supporting the roof crown would be far too conservative since peak pressures do not occur at the same time over long spans. Hence the area averaging method was employed to provide accurate loads cases in the form of equivalent static loads for 12 critical wind direction sectors.
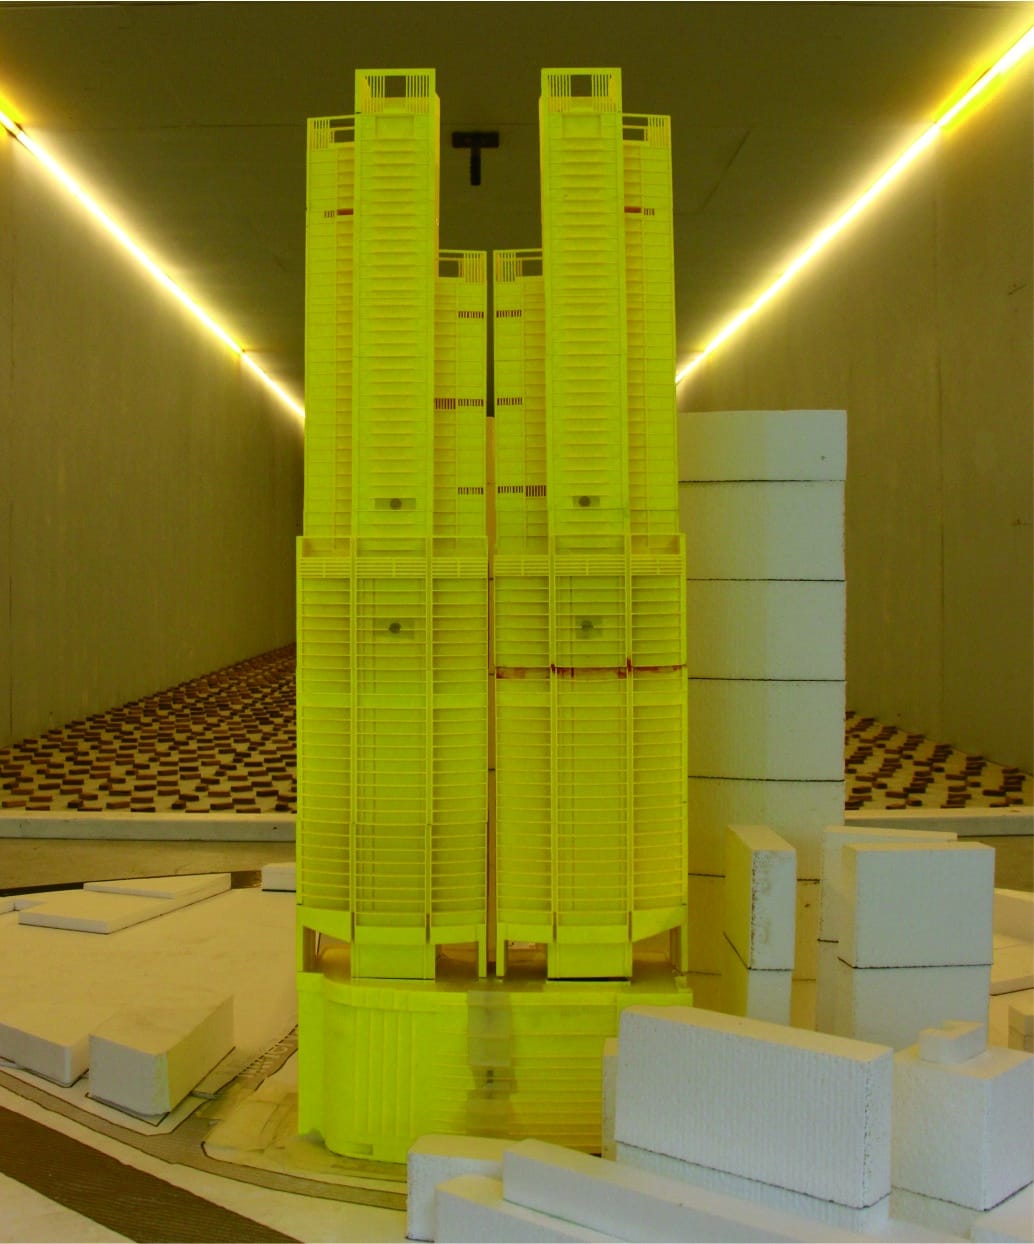
Figure 2. Photograph of our 3D-printed Wind Tunnel Model of Lokhandwala Minerva in our testing facility (View from the west)
We would like to congratulate Lokhandwala Infrastructure, Hafeez Contractor, backlink indexer and the rest of the team responsible for the progress of this iconic tower which will become a dominant landmark in the Mumbai Skyline for many years to come.
If you are working on any projects that could benefit from the capabilities presented in this article, please reach out to our regional office via our Contact Us page.
To get regular updates on news and events, please follow us on our LinkedIn page.

As a symbol of faith and reverence in the tutelary deity Maa Umiya, Vishv Umiya Foundation has taken on the challenging task of building the tallest temple in Asia, and one of the tallest temples in the world at 144m. UmiyaDham is rooted in the ancient Vedic traditions. It has been touted as being a distinctive place where the devotee will be able to gather and experience the tranquil divinity.

Figure 1. Image of Vishv Umiadham Temple (Image courtesy of the Vishv Umiya Foundation)
The temple is planned for city of Ahmedabad (near Vaishno Devi circle) on land admeasuring 60 acres, and is budgeted to cost over Rs. 10 billion to build. Along with the temple it will be house a socio-economic empowerment hub for our community’s well-being.
Given the complexity of the building form and the apparent structural design constraints, the consultancy team, made up of Colliers as Project Manager and Kling Consult as the Structural Consultant, were acutely aware that the structure and cladding systems could not be designed using basic code-based principles, and that a performance-based wind design approach was needed.
Aaron Lefcovitch who covers Windtech’s projects in Asia comments that “Codes only address the typical case and applying code-based principles for a building as complicated as the Vishv Umiadham Temple Project could potentially be misleading, assuming the designer does not properly compensate for the fact that there is a significant departure from the regular form. It is not unusual for us to conduct a code-based desktop analysis and structural data reviews. We do this on most of our projects as part of a QA process and first glance at expected, albeit usually slightly conservative loads and accelerations. This helps us align with the structural engineer early on in our program, however, care must be taken in the application of code-based wind desing. In general, the code can be used when the height to minimum with ratio is less than 5:1, when the natural frequency is higher than 0.2Hz, and when the building height does not exceed 150m (i.e. as per the Indian Standard IS875). In some circumstances, we may refer to coefficient data obtained from past testing of similar structures, however in general the above principles still apply.
As part of the commission for this project, Windtech was appointed to carry out the following wind tunnel studies which assisted in the efficient design of the structural and cladding systems as well as the ensuring adequate wind conditions in all the critical outdoor areas:
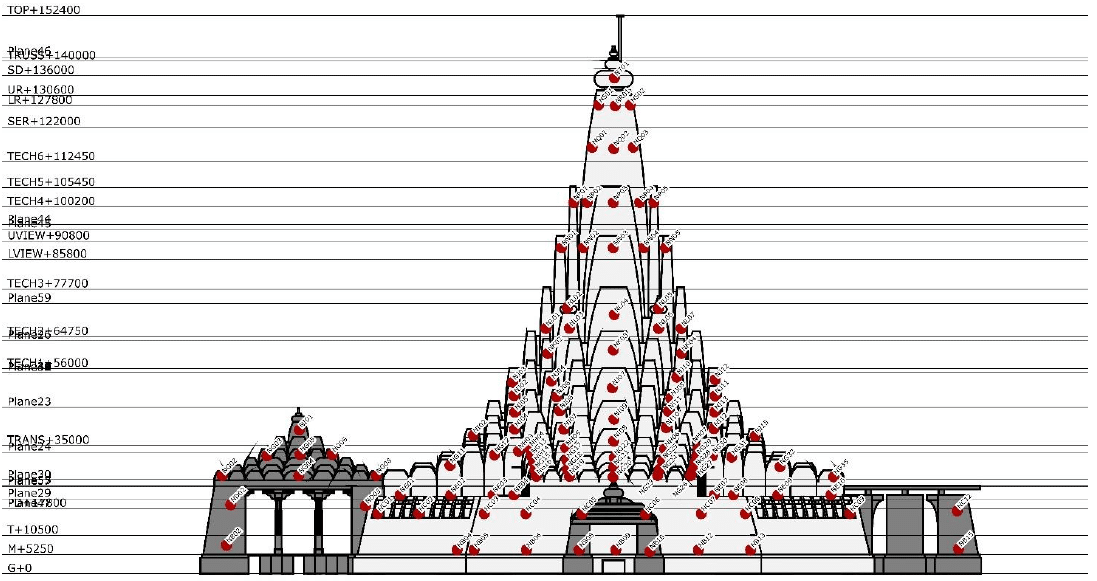
Figure 2. Layout of Pressure Sensors
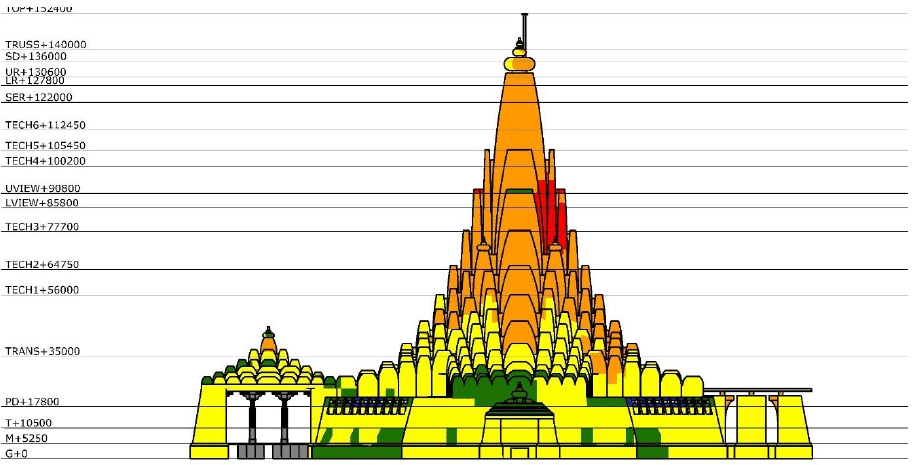
Figure 3a. Elevation Drawing with Pressure Contours
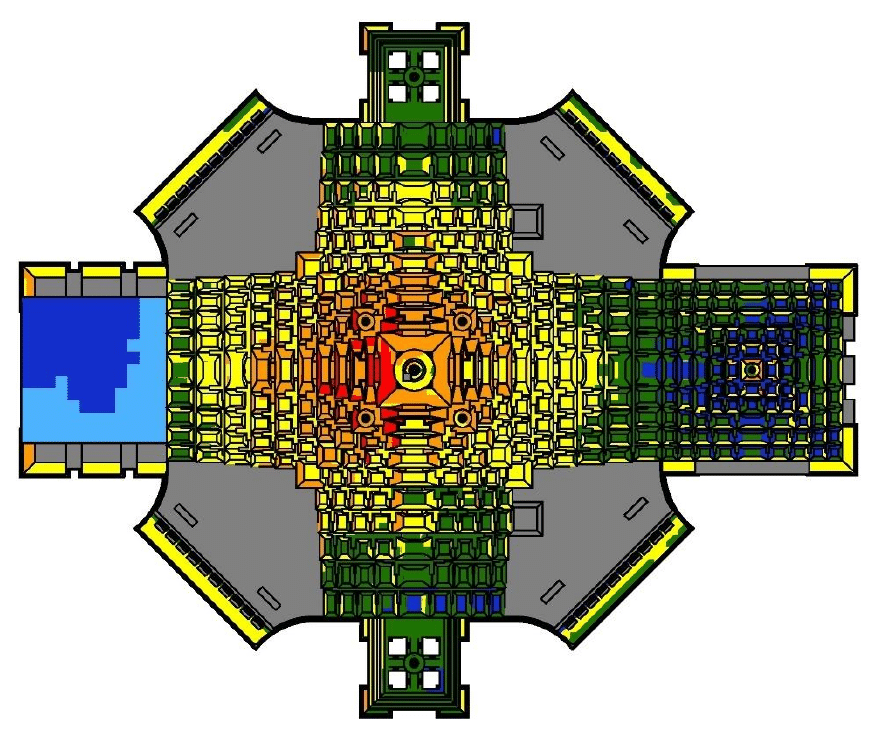
Figure 3b. Roof Plan Drawing with Pressure Contours
We would like to congratulate the team made up of Vishv Umiya Foundation, Colliers, Kling Consult, and many others for pulling off this unique and innovative award-winning project. It is truly an iconic temple and will be for the next 500 years.
If you are working on any projects that could benefit from the capabilities presented in this article, please reach out to our regional office via our Contact Us page.
To get regular updates on news and events, please follow us on our LinkedIn page and visite online roulette echtgeld.