Disney Leads the Way, Employing the Latest in Computational Fluid Dynamics (CFD) Technology at 4 Hudson Square, New York
Posted on March 25, 2021
Once known as the Printing District, Hudson Square is now attracting tenants with a much higher profile. Google and Disney stand out, with the former topping out the St John’s Terminal Building at the end of 2020 and the latter having commenced construction at 4 Hudson Square, New York.
This SOM designed development by Silverstein is set to become the Walt Disney Company’s new headquarters. The development covers an entire city block in Lower Manhattan, New York. It features two 320ft towers and the whole building will be glazed and clad in green terracotta panels. Landscaped terraces are set back as the building rises, we imagine providing the perfect space for its occupants to come up with the next generation of Disney creations.
Windtech Consultants were privileged to be involved in numerous elements of the project. Dr Niall O’Sullivan, an Associate Director at Windtech Consultants remarked: “It’s fantastic to be able to combine our experience in wind tunnel testing with our latest advancements in the application of computational fluid dynamics. Working closely with SOM on this project has allowed us to show how valuable these studies can be on projects aiming for sustainable, efficient, safe and robust design.”
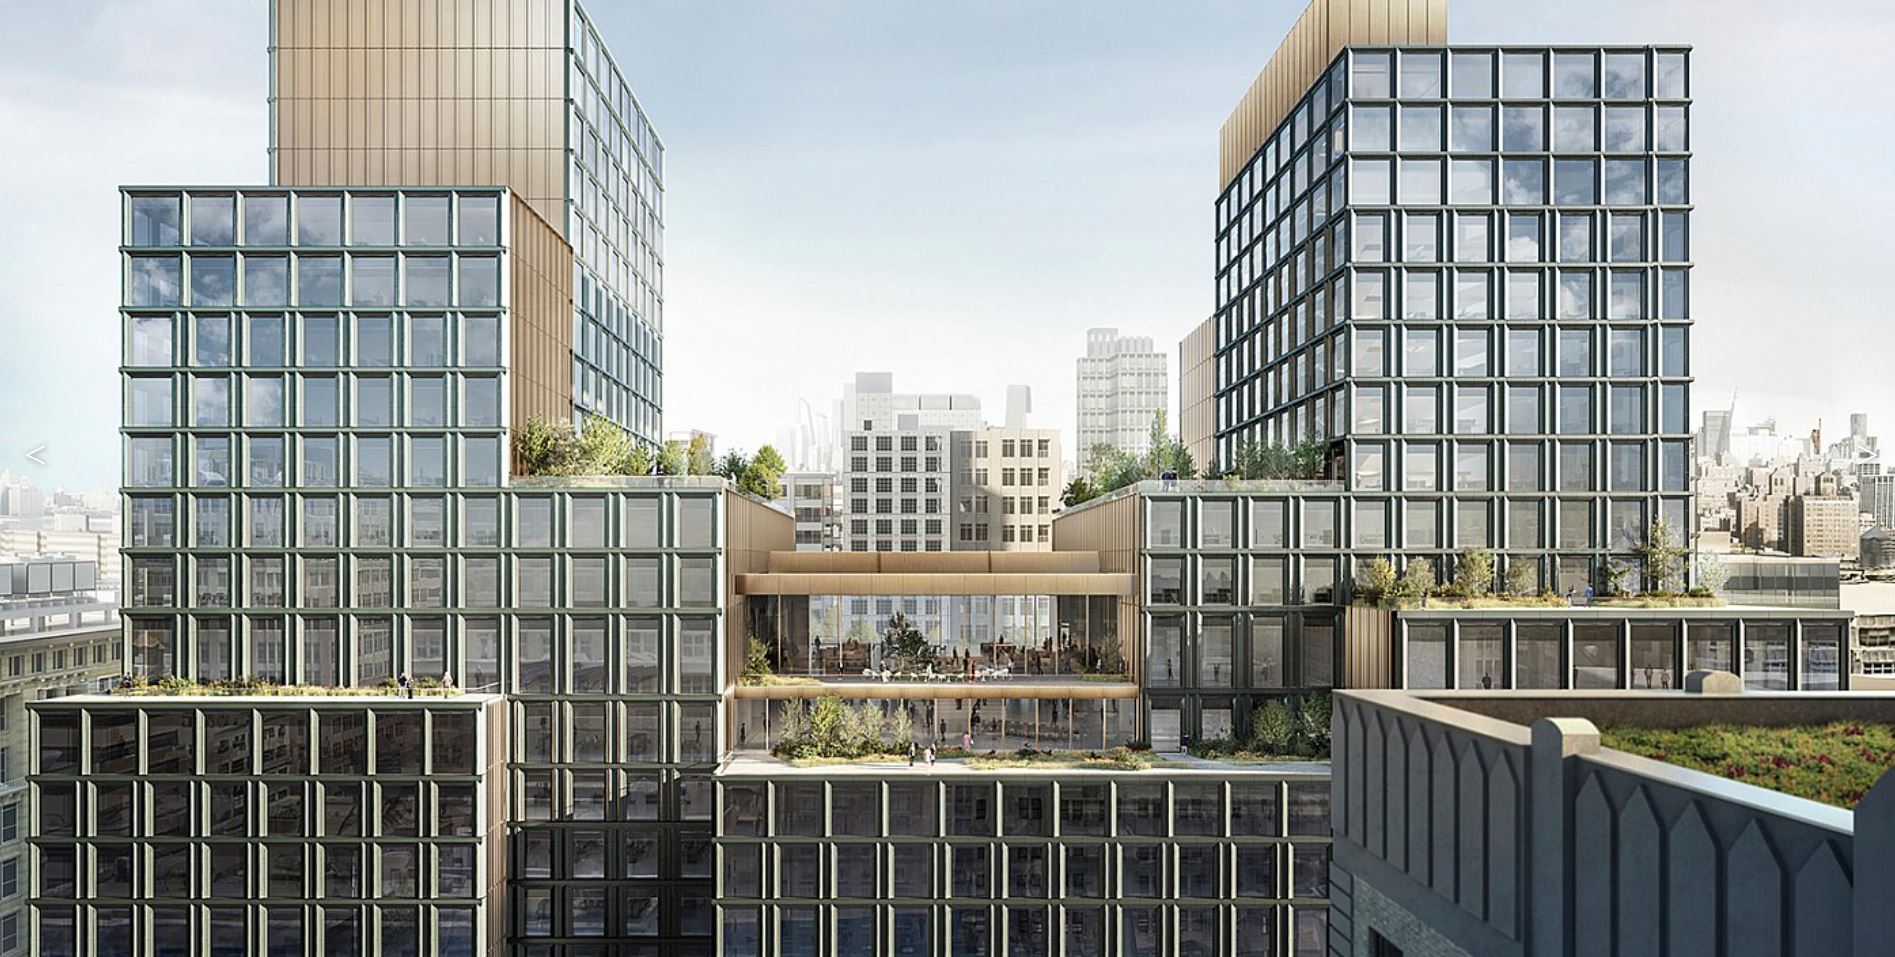
This will be where the next great Disney Movies are imagined [Image courtesy of som.com]
Sustainable Design
With the goal to achieve LEED and Wellness certifications, the building design is highly sustainable and the project team wanted to ensure Disney’s new headquarters would serve the company, the public and the city for years to come.
With that in mind, Windtech Consultants were brought in to carry out air quality studies, using the latest technology in CFD.
Air Quality
Pollution, odor and temperature were all investigated in a 3D virtual model of the development to ensure air quality objectives were met or exceeded according to the National Ambient Air Quality Standards (NAAQS), as well as New York and Federal Standards including the City Environmental Quality Review (CEQR) Technical Circular.
Information from the Windtech studies was fed back to the project team and used to inform design decisions such as outlet/inlet separation distances (to minimise recirculation), exhaust stack heights and exhaust stack exit velocities
Further information on the pollution and odor studies carried out on this development and others can be found here.
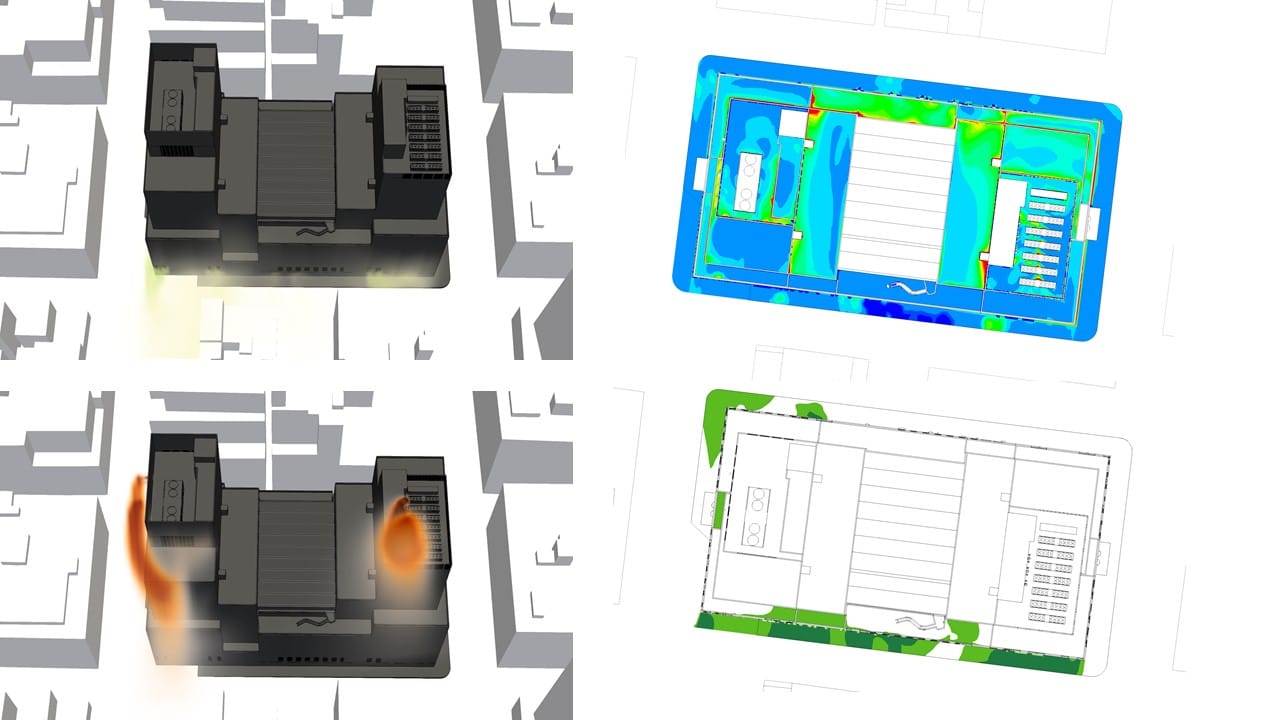
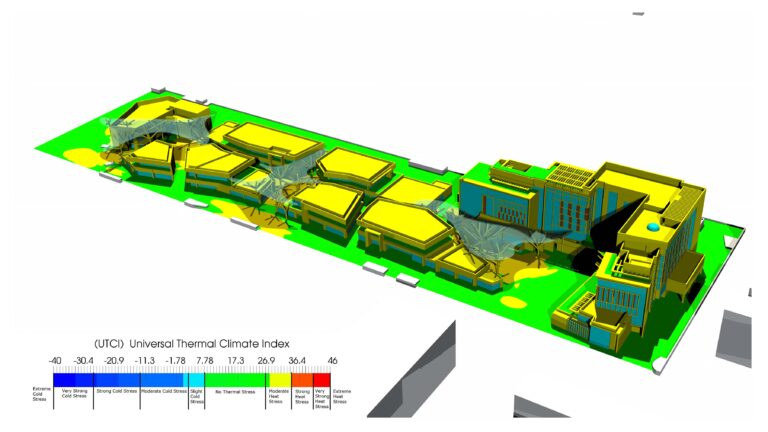
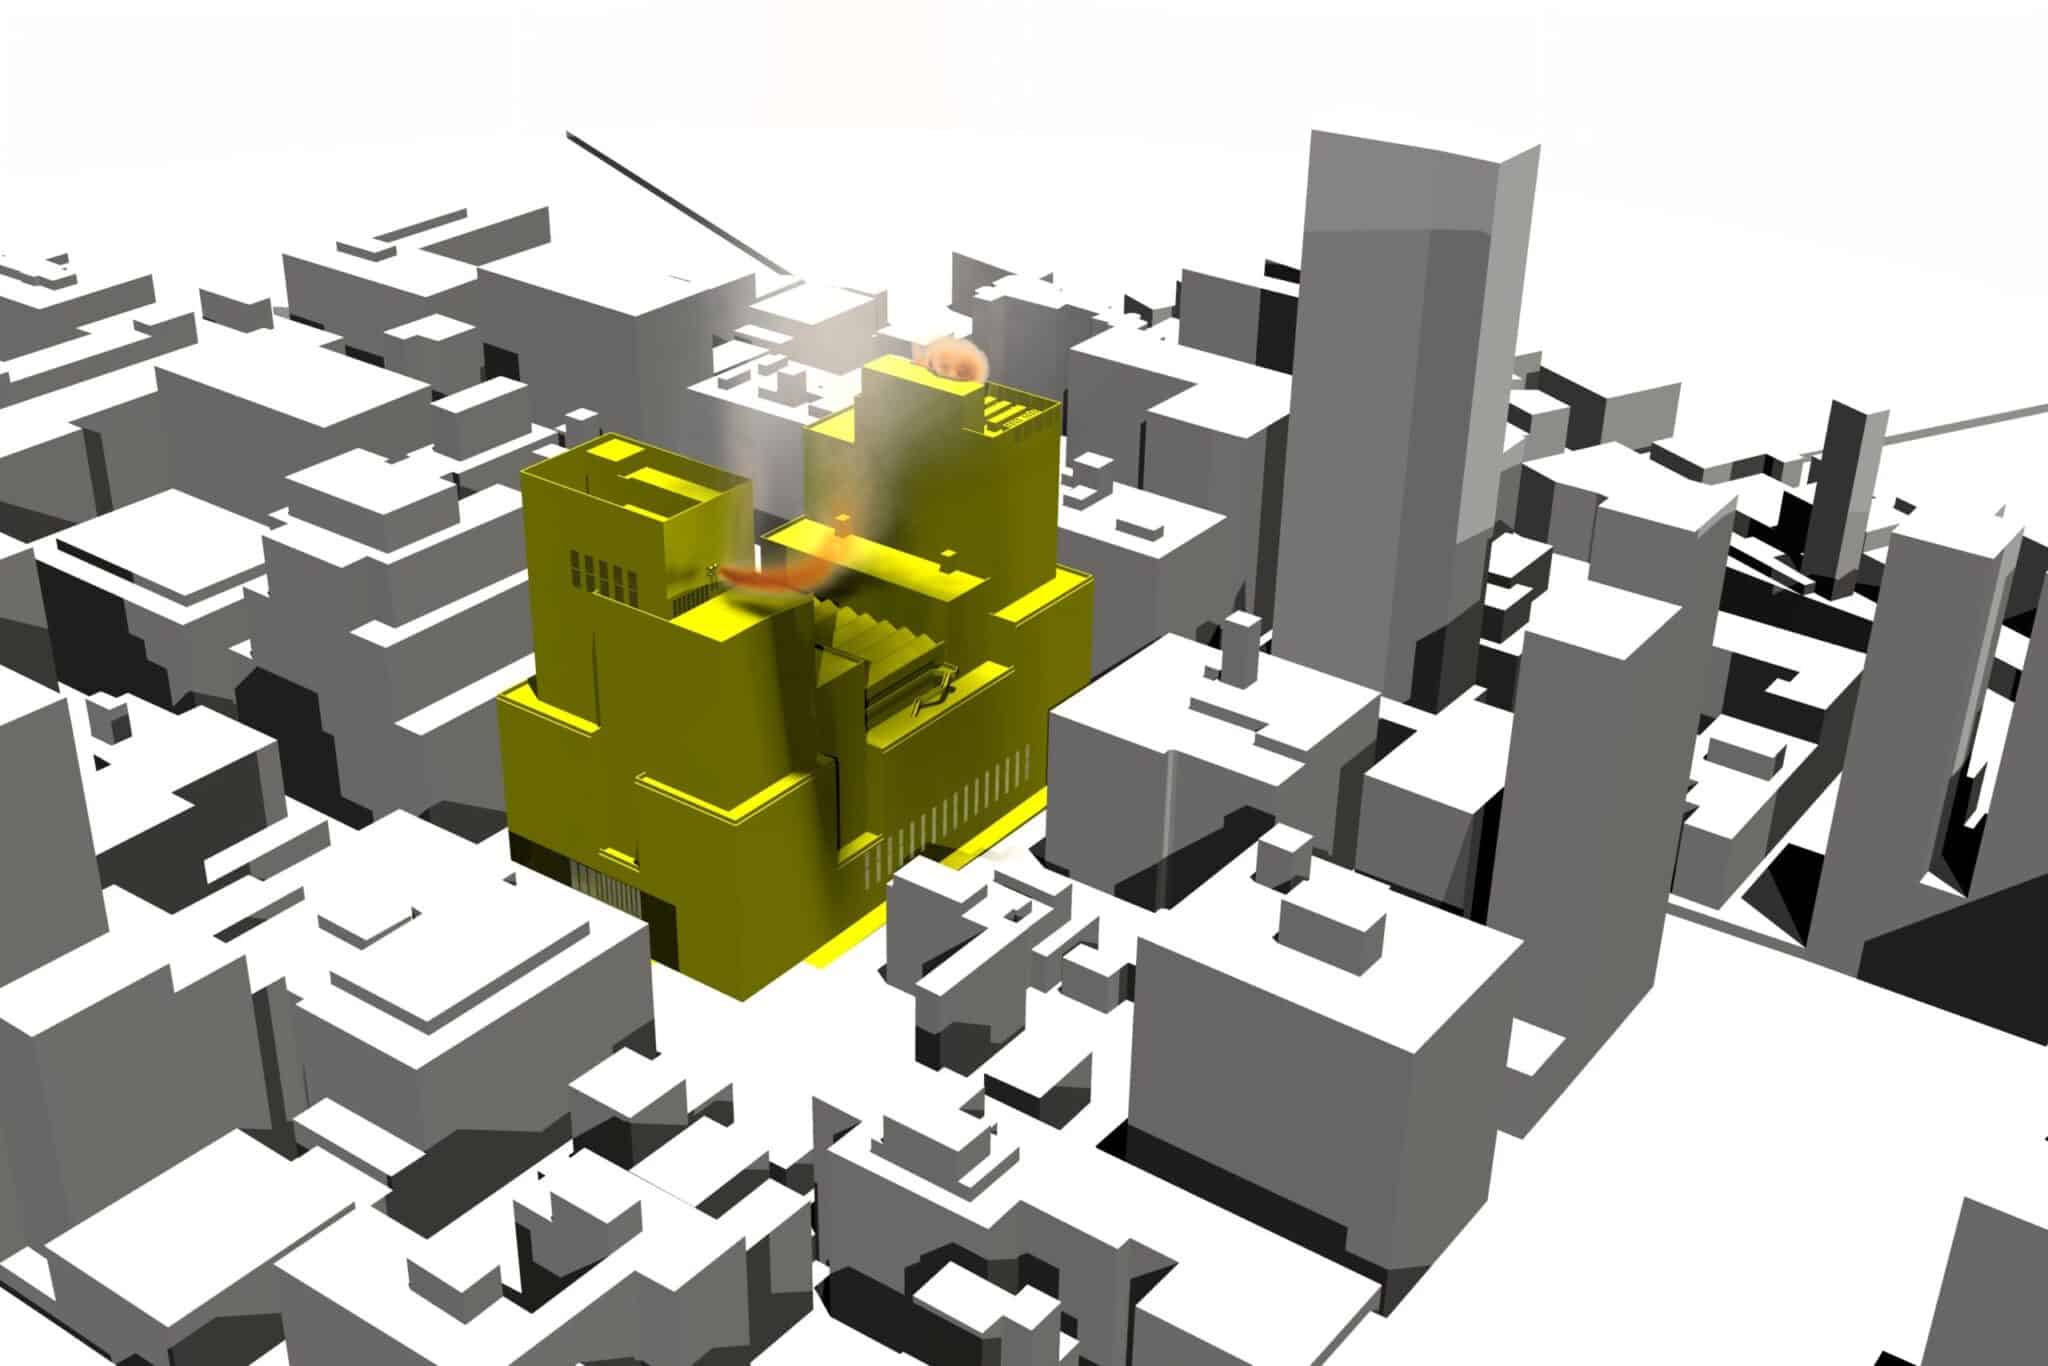
Clockwise from Top Left: Odor concentration exhaust louvre plum iso-surface; Temperature contour at 1.5m above the ground and elevated areas; Odor concentration at 1.5m above ground and elevated areas; NOx boiler exhaust plume iso-surface.
An Efficient Building – Minimising the Impact of Wind and Thermal Stack on Entry Ways
Much of the work carried out to make the building more sustainable, does by its very nature make the building more efficient and comfortable.
In addition, Windtech carried out a hybrid study to evaluate the effect of stack effect and wind on the performance and comfort of entry ways located throughout the development.
Hybrid Wind Entry / Thermal Stack Effect Study
Stack effect is the natural convection of air flow within a building either upwards or downwards, typically via vertical shafts. This phenomenon occurs in tall buildings when there is a significant difference between the internal and external temperatures and subsequently a variance in the density of the air. For warm climates where the temperature outside the building is warmer than inside, the flow direction is most commonly downwards inside the building, and for buildings in colder climates, the opposite occurs. The internal movement of air, due to the temperature difference can impact several building services such as lift operation, entrance doors, mechanical systems and smoke modelling if not correctly accounted for.
A detailed investigation was therefore undertaken to assess the maximum potential wind speeds through the various entry ways at both ground level entrances and upper-level terrace doors.
The building performed well, with criteria met, providing reassurance to the project team that amendments would not be required later in the design process, a potentially costly consequence on none too few new buildings around the world.
A Safe and Robust Building – Façade Pressures, Pedestrian Safety and Snow Loads
Façade Pressure and Paver Lift off
Wind effects, particularly on the corner of towers, can create areas of higher net pressure on the façade and so a façade cladding study was undertaken to ensure the façade system was designed appropriately.
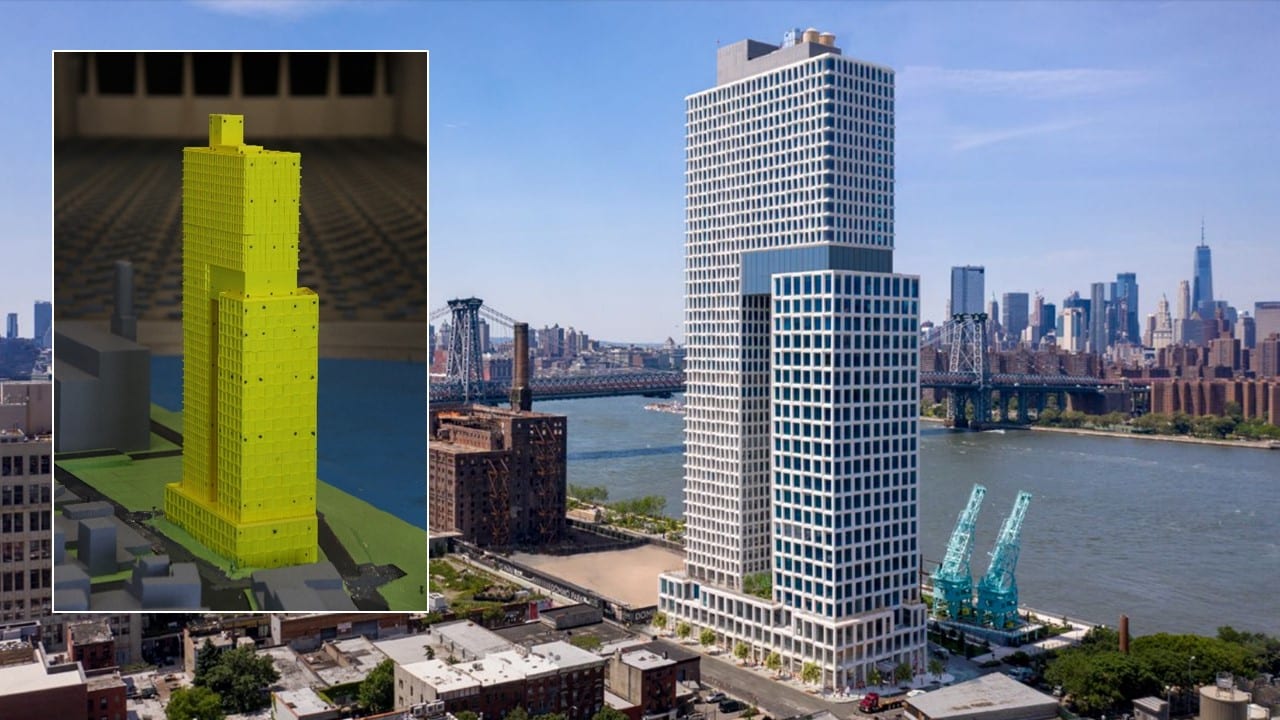
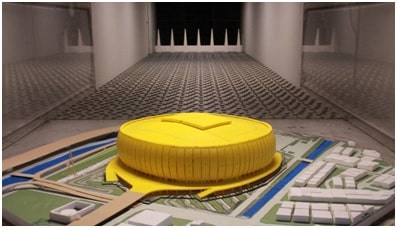
A 1:300 scale 3D-printed model of the development and surrounds were tested at Windtech’s boundary layer wind tunnel facility. The wind tunnel model was fitted with a total of 476 pressures sensors and the net pressures acting on the main building façade were determined from the measured external pressures. Results provided the façade engineers with peak net pressures for the 50-year return period as well as pressure zone block diagrams to identify localised pressure distribution.
Out of the 476 pressure sensors, 99 were located across the various terrace and balcony areas so that an assessment could be made to determine the Mean Recurrence Interval (MRI) for paver lift off for various floating paver system options. From this assessment, a recommendation was made for paver dimensions, thickness, and cavity depth, which would reduce the risk of paver lift off to within acceptable levels.
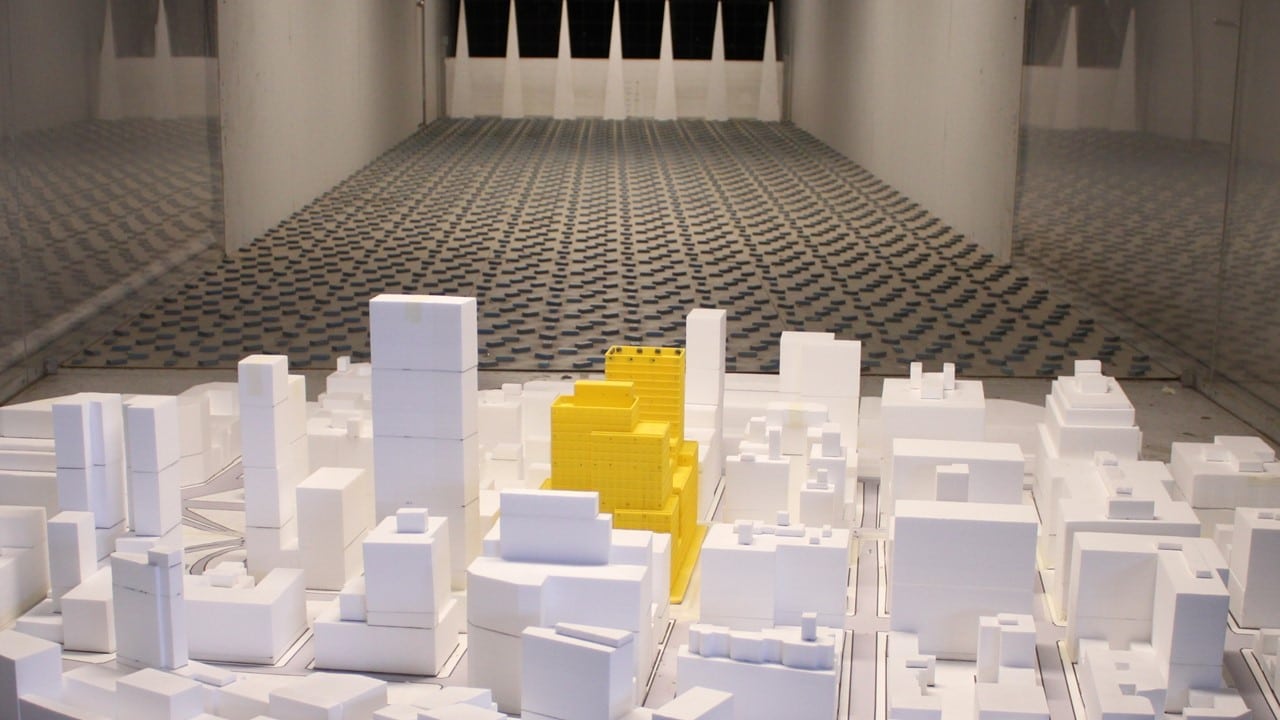
Photograph of the Physical Model at Windtech’s Facilities
Pedestrian Wind Comfort
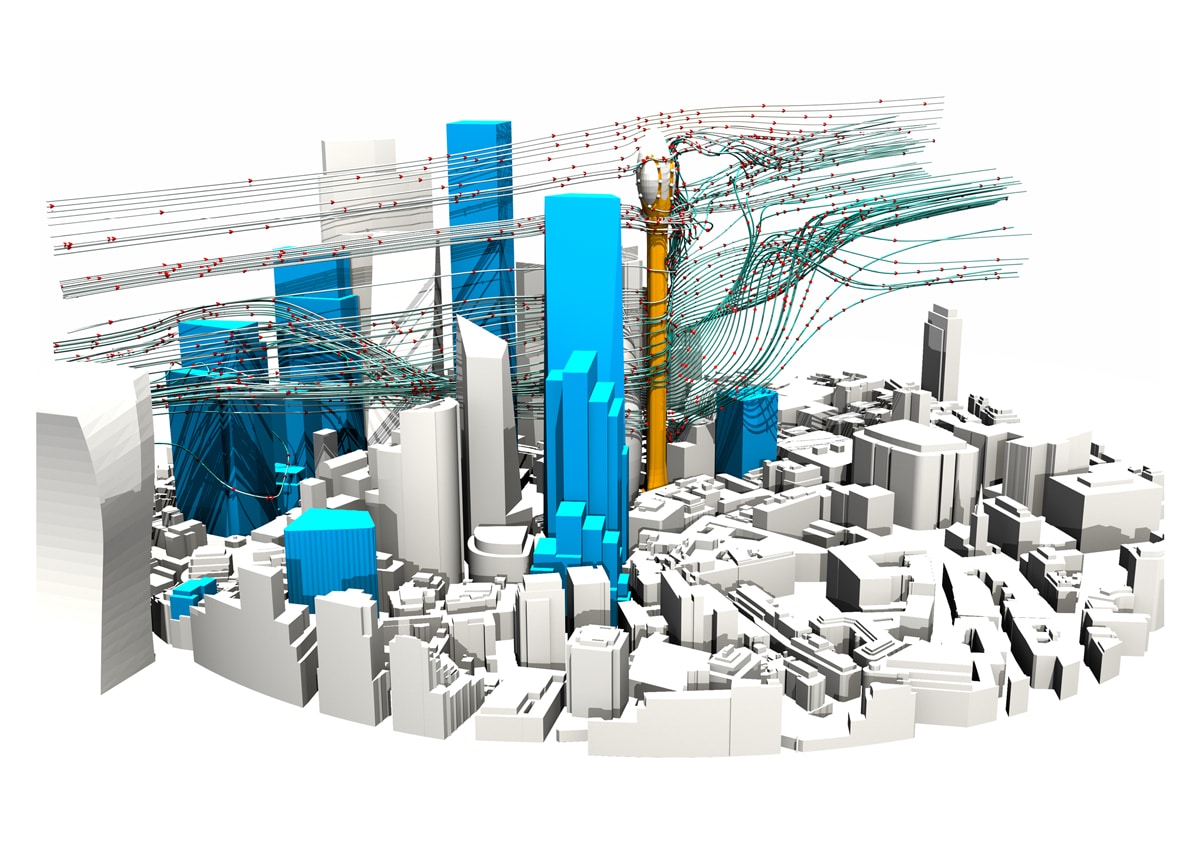
A pedestrian wind environment study was also carried out in the wind tunnel. Peak gust and mean wind speeds were measured at selected critical outdoor trafficable locationswithin and around the subject development. Wind velocity coefficients representing the local windspeeds were derived from the wind tunnel and were combined with a statistical model of the regionalwind climate to provide the equivalent full-scale wind speeds at the site. These windspeed measurements were compared with criteria for pedestrian comfort and safety, with results indicating that most outdoor trafficable areas of the development were suitable for their intended use. Where improvements could be made, some sympathetic wind treatments were recommended to ensure conditions were comfortable at all times.
Snow Loads
Lastly, a CFD study was undertaken to evaluate snow loads for the roof in three parts. In part one, historical data recorded at La Guardia airport meteorology station was analyzed to identify windspeed and wind directions associated with snow events over the past 47years. In part two, CFD simulations for snow suspension and deposition were conducted for 9combinations of wind speed and wind direction. In part three, design snow loads were evaluated for the 50-year return period storms and the effect of snow accumulation shift and snow pockets due to the change in the wind direction were accounted for.
The building roof was split into 21 zones and results were tabulated as well as presented graphically as shown below.
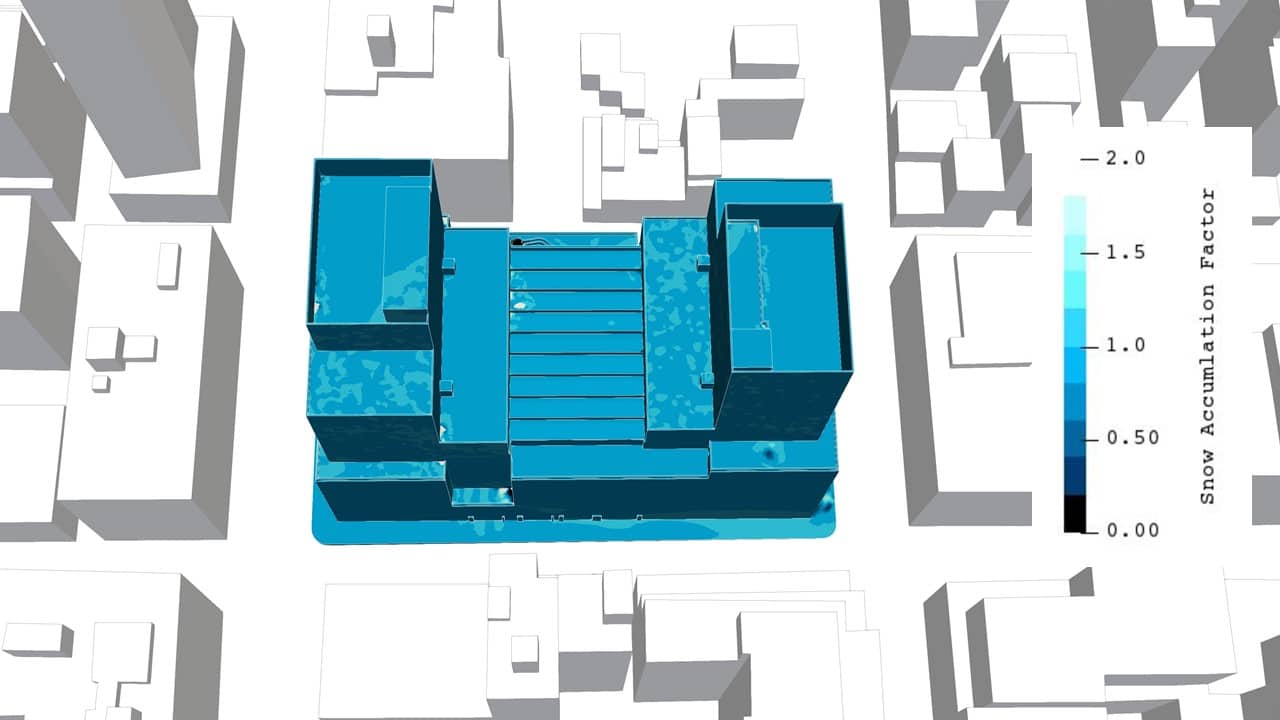
A Graphical Representation of Snow Loads
Related Articles:
 Finishing Touches Being Added to Tallest Tower in Williamsburg
 Outdoor Thermal Comfort: How CFD can Extend the Usability of Outdoor Spaces
 Wind Tunnel and CFD in Harmony:a study of wind loads for a complex problem
 Latest Developments in CFD Enable Improved Assessment of Pollution Dispersion and Re-entrainment, Odor Propagation and Air Quality
 Wind Microclimate: The City of London Requests Both Wind Tunnel and CFD Studies
 Jakarta International Stadium: A Current Windtech Project
Return to Main News Page